
"The Alarm Is Lying to You" — Base Rates & the Positive-Test Paradox
The Alarm Is Lying to You
Picture a security tool that catches 95% of real intrusions and correctly clears 98% of harmless activity. That sounds like a system you can trust. Now picture this: of everything it flags in a year, fewer than 1 in 10 alerts turns out to be real.
Both of those things are true at once, and neither one is a trick. It's what happens whenever you're hunting for something rare with an imperfect detector — and it's one of the most consistently misunderstood ideas in risk, security, and quality management. It's called the base rate problem, and once you've seen it, you start noticing it everywhere.
NOTE - at the end of this article there is a link to an interactive Base Rate tool, if you don’t want to read the article and just play around take a look at the base rate tool here.
Four numbers worth knowing
Any detector — a security tool, a background-check test, a smoke alarm, a fraud model — can be described with four numbers:
Prevalence — how common the real thing actually is. Often the whole story starts here, and it's usually much lower than people assume.
Sensitivity — how good the detector is at catching real cases when they occur.
Specificity — how good the detector is at correctly clearing everything that isn't a real case.
Precision — of everything the detector flags, what share is actually real. This is the number that determines whether a flagged item is worth your trust — and it's the one most conversations about "accuracy" skip entirely.
Sensitivity and specificity describe the tool. Precision describes what happens when you point that tool at your actual, rare-event world — and precision is where things get counterintuitive fast.
The IT security example
Say a company's intrusion detection system evaluates 10,000 alert-worthy events over a year, and only 20 of them are genuine security incidents — a prevalence of 0.2%. That's realistic: real breaches are rare relative to the sheer volume of unusual-but-harmless network activity a modern system sees every day.
Now run a genuinely good detector against that: 95% sensitivity, 98% specificity — numbers a vendor would happily put in a sales deck.
| Description | Count |
|---|---|
| Real incidents | 20 |
| Caught by the detector (true positives) | 19 |
| Harmless activity wrongly flagged (false positives) | ~200 |
| Total alerts raised | ~219 |
| Precision (real among flagged) | ~9% |
Nineteen real incidents caught — that part's genuinely good. But the tool raised 219 alerts to catch them. Fewer than 1 in 10 alerts a security analyst investigates that year will turn out to be real. That's not a flaw in the tool. That's what a 95%/98% detector does, unavoidably, once the thing it's looking for is this rare. And it's exactly how alert fatigue starts: analysts wading through hundreds of false alarms a week eventually start moving faster and looking closer, in that order — which is precisely when a real one gets missed.
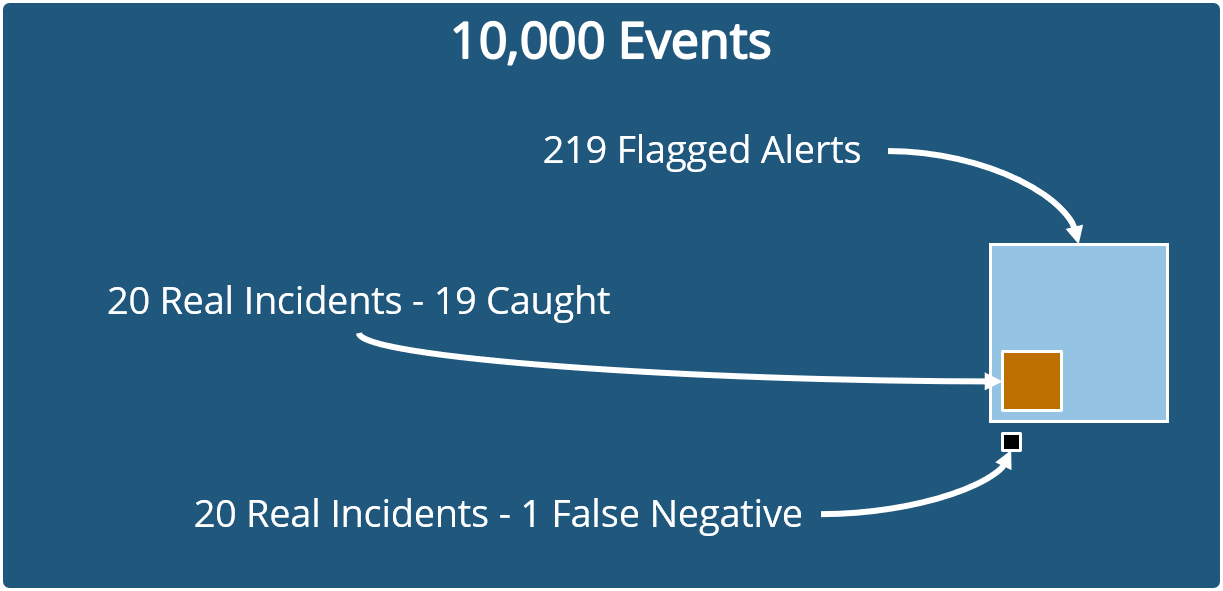
Real vs Flagged IT Security Events
How this looks in other departments
The same math shows up anywhere a rare event meets an imperfect detector — it's not an IT-specific problem, it's a numbers problem that IT just happens to run into constantly.
| Department | The rare thing | What a realistic detector flags in a year | How many are actually real | Approx Precision |
|---|---|---|---|---|
| IT / security | 20 real incidents out of 10,000 alert-worthy events | ~219 alerts | 19 | 9% |
| HR | 30 employees genuinely at flight risk out of 500 | ~73 employees flagged | 26 | 35% |
| Finance / AP | 50 fraudulent claims out of 50,000 processed | ~2,543 claims flagged | 45 | 2% |
| Real property / facilities | 1 real fire out of 2,000 alarm-triggering events across a portfolio | ~11 alarms | 1 | 9% |
HR's attrition-prediction models flag "at risk" employees the same way — even a fairly good model ends up with roughly two-thirds of its flagged list being people who were never actually leaving, which is retention budget and manager attention spent chasing false alarms. Finance's AP fraud detection is the starkest example on this list: fraud is often well under 1% of claims, so even a solid detector can mean fewer than 2 in 100 flagged claims are real fraud — an audit team drowning in noise, which is exactly the condition under which real fraud slips through unnoticed. And building fire/security alarm systems carry the sharpest version of this problem, because the stakes of a missed real event are the highest on this list — "the boy who cried wolf" is a base rate problem with a life-safety consequence.
So what do you actually do about it?
| If the real event is… | Then… | Because… |
|---|---|---|
| Very rare (well under 1% of cases) | Expect most flags to be false positives, even from a system that sounds highly accurate | Precision collapses as prevalence drops, regardless of how good sensitivity and specificity are |
| Moderately common (roughly 5-15% of cases) | A flagged list is worth real scrutiny, and false positives become more manageable | The gap between "flagged" and "actually real" narrows as the true rate rises |
| High-stakes to miss (fraud, breach, fire) | Tune deliberately, and keep a human reviewing flagged items rather than auto-acting on them | The sensitivity you genuinely need may mean accepting more false alarms, not fewer — that's a trade-off to make on purpose, not by accident |
Try it yourself
The same four numbers — prevalence, sensitivity, specificity, precision — drive every example on this page. Below is the same idea, live: set how rare the real event is, set how good the detector is, and watch precision respond. If you want to open up the tool in a new tab rather than the iFrame click here https://tools.davhill.com/charts/base-rate/
Try this: start with a low prevalence and watch precision stay stubbornly low even as you push sensitivity and specificity up toward 99%. Then raise prevalence and watch the same detector suddenly look far more trustworthy — same tool, same accuracy numbers, completely different real-world reliability. That gap is the whole article, made tangible.
The question worth asking isn't just "how accurate is this system." It's "how rare is the thing it's looking for, and what does that do to the number that actually matters" — precision, not accuracy, is what tells you whether a flagged item deserves your attention.
Where this shows up beyond the dashboard
This is the same kind of judgment call we want to make people aware of across every department that leans on detection systems, thresholds, or predictive flags — not just computing an accuracy number, but understanding what that number actually means once you point it at how rare the real event is. If your team is evaluating a security tool, a screening process, or a predictive model and the vendor's pitch is "X% accurate," this is the follow-up question worth asking before you buy.
You'll find more of these interactive concept demos — descriptive statistics, sampling methods, regression versus causation, and others at tools.davhill.com.
Stephen Davies, DAVHILL Group. Connect on LinkedIn.